
 sales@resultfirst.com
How to Measure the ROI of Your Content Marketing Investment

Publishing content consistently is a significant investment of time, talent, and capital. Your team brainstorms, you hire specialized writers, and you subscribe to an ever-expanding stack of marketing tools. Yet, many departments operate on a “publish and pray” model, failing to bridge the gap between creative output and fiscal impact.
Content without measurement is just noise. You need to know what works and what drains your budget. That is where content marketing ROI steps in. It turns your creative efforts into hard numbers. It shows you what moves the needle and what simply takes up space on your website.
This guide gives you a clear roadmap. You will learn the right metrics to track. You will get the exact formulas to use. And you will walk away knowing how to make smarter decisions with every content dollar you spend.
What Is Content Marketing ROI and Why Does It Change Everything
Content marketing ROI stands for return on investment. It measures how much revenue your content generates compared to what you spent producing and distributing it.
The formula is simple.
ROI = ((Revenue from Content – Cost of Content) / Cost of Content) x 100
Here is a quick example. You spend $500 creating and promoting a blog post. That post drives $2000 in new business. Your profit is $1500. Your ROI is 300%.
Simple. Powerful. And completely actionable.
Why Most Teams Skip This Step and Pay the Price
Many teams track vanity metrics. Page views. Social media followers. Email open rates. These numbers feel good in a presentation. But they do not tell you if your content is generating revenue.
Without ROI data, you end up:
- Spending money on content types that do not convert
- Defending your budget without hard proof of impact
- Repeating strategies that look active but deliver nothing
- Missing the high-performing content that deserves more investment
According to the Content Marketing Institute, only 43% of B2B marketers say they measure content marketing ROI. That means more than half are flying blind.
The Key Metrics That Actually Tell You If Your Content Is Working
Before calculating ROI, you should monitor the appropriate figures. The following are the metrics that are most important.
Conversion Rate
A conversion occurs when a visitor performs the specific action that you desire. They buy something. They fill out a form. They book a demo.
Conversion rate = Total Conversions / Total Visitors x 100
A piece of content with a 5% conversion rate means five out of every hundred visitors took action. High conversion rates show that your content attracts the correct audience. Your content should draw both high traffic and the appropriate audience.
Customer Acquisition Cost (CAC)
CAC tells you how much money you have paid to obtain one paying customer of a particular piece of content or content channel.
CAC = Value of Content Investment/ New Customers.
When you track CAC across different content types, you quickly see which formats bring in customers at the lowest cost. The insight provides enough information to completely change your content strategy.

Customer Lifetime Value (CLV)
A customer is not just one transaction. Customer lifetime value (CLV) calculates the total revenue generated by a customer during their entire relationship with your business.
Why does this matter for content ROI? Because some content attracts one-time buyers. Other content attracts loyal repeat customers worth ten times more.
Organic Traffic and SEO Metrics
Organic search drives long-term compounding ROI. Track these signals:
- Keyword rankings for commercial-intent terms
- Number of pages receiving organic traffic
- Click-through rates from search results
- Domain authority growth over time
- Inbound links earned through content
Lead Quality Score
Not all leads are equal. A lead who downloads a pricing guide is more valuable than one who reads a general blog post. You need to monitor your lead sources while calculating the customer conversion rate from those sources. This reveals which content attracts buyers versus browsers.
The Tools That Make Measurement Actually Work
Good data requires good tools. Here are the three platforms that professional teams rely on.
Google Analytics 4
GA4 is your foundation. It tracks every interaction on your website. Page sessions. Time on page. Bounce rates. Conversion events. You can assign a monetary value to each conversion, and GA4 will calculate revenue attribution for you.
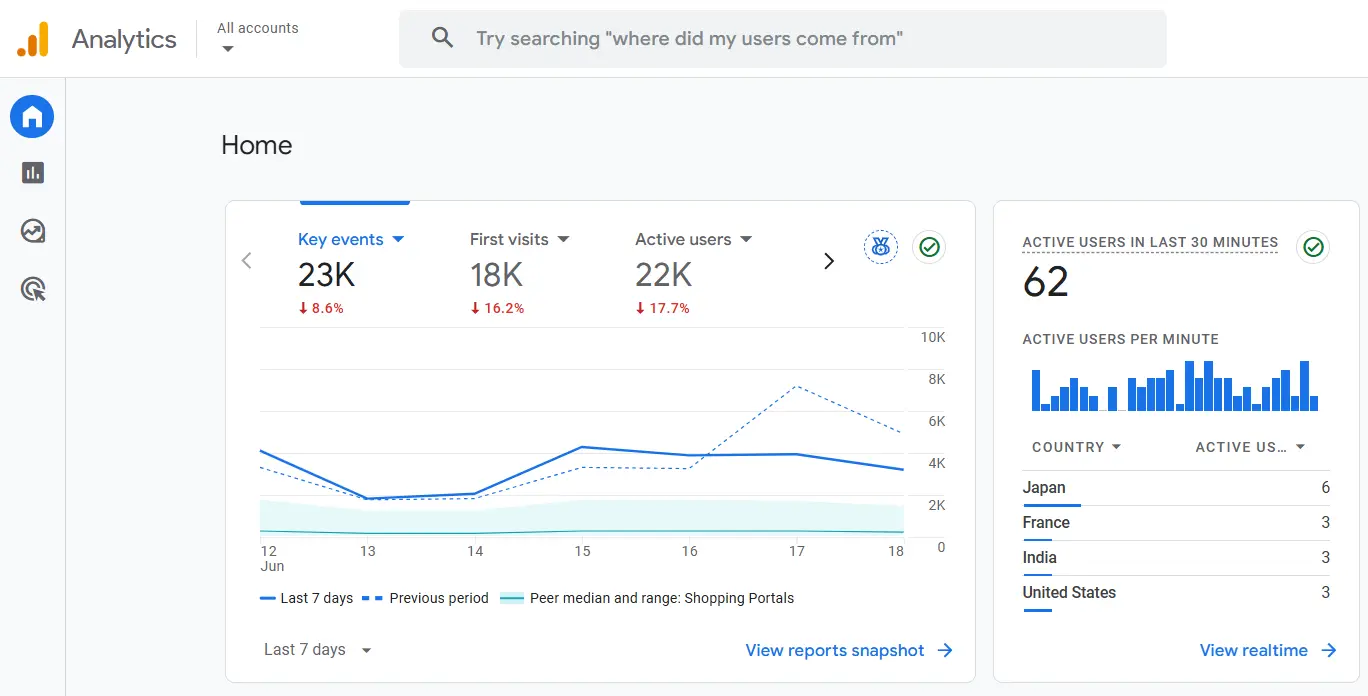
Set up conversion events under Admin > Events. Tag each lead form submission and purchase. Then pull reports under Monetization to see which content drives actual revenue.
HubSpot
HubSpot connects your content performance to your CRM. You see which blog posts generate leads and which of those leads close into customers. Make ROI easy to visualize at a single glance on custom dashboards, without the trouble of forming complex spreadsheet models.
HubSpot research shows that companies using inbound marketing strategies generate 54% more leads than outbound methods. Tracking that through HubSpot turns the insight into action.
The Step-by-Step Process to Measure Your Content Marketing ROI
Here is a repeatable system you can apply to any content initiative.
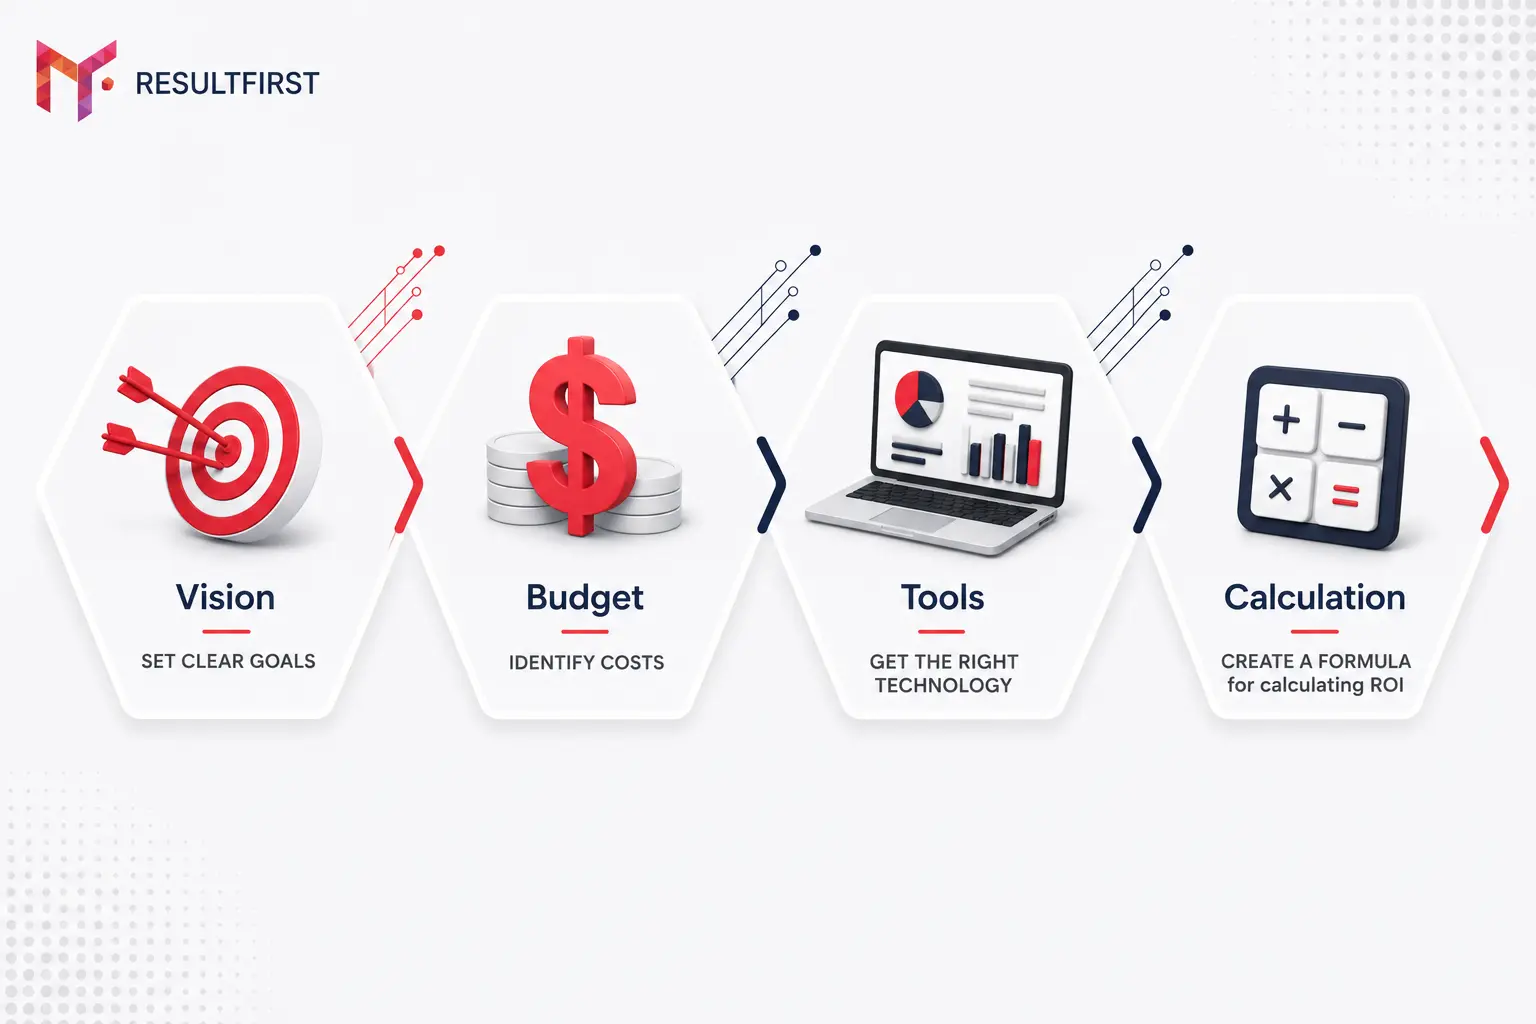
Step 1: Set Clear Objectives Before You Create Anything
ROI measurement starts before the first word gets written. You need to define success criteria for every content piece.
You should ask yourself the following questions.
- Is this information supposed to create leads or close sales?
- Do you target new or retain customers?
- What do you want the readers to do?
Your objective determines your KPI. Your KPI determines how you measure ROI. The process requires this step because it helps you track the correct elements that lead to accurate results.
Step 2: Track Every Dollar You Spend on Content
Most teams only count ads spend. That is a mistake. True content costs include:
- Writer fees or in-house salary allocation
- Design and video production costs
- SEO and keyword research tools
- Content management platforms
- Distribution and promotion expenses
- Social media management time
Step 3: Install Tracking Before You Launch
Set up your analytics before your content goes live. This means:
- Adding UTM parameters to every link you share
- Creating conversion events in GA4
- Setting baseline traffic and revenue numbers for comparison
Tracking installed after launch means you miss early data. And early data is often your most valuable signal.
Step 4: Give Your Content Time to Perform
Content marketing is not a sprint. It is a marathon.
Only 5.7% of newly published pages rank in the top 10 search results within a year. SEO-driven content can take six to twelve months to reach its full traffic potential.
Short measurement windows produce misleading results. Create your reporting schedule based on three distinct time frames, which are 30-day, 90-day, and 180-day periods. The current system provides you with immediate performance indicators while also delivering results that extend to future evaluations.
Step 5: Apply the ROI Formula to Each Content Piece and Channel
Now run the numbers.
ROI = ((Revenue from Content – Cost of Content) / Cost of Content) x 100
Run this calculation for:
- Individual blog posts
- Types of content (how-to guide vs. thought leadership)
- Distribution channels (organic search vs. email vs. social)
- Content formats (video vs. written vs. infographic)
This granular view shows you exactly where to invest more and where to pull back.
Advanced Metrics That Separate Good Marketers from Great Ones
The LTV to CAC Ratio
This ratio tells you how efficiently your content attracts high-value customers.
LTV: CAC = Customer Lifetime Value / Customer Acquisition Cost
A healthy ratio sits at 3:1 or higher. This means a customer is worth at least three times what it costs to acquire them. If your ratio falls below 1:1, your content is acquiring customers at a loss.
According to a study by McKinsey, companies with strong customer analytics capabilities are 23 times more likely to acquire customers. The LTV: CAC ratio is one of the most powerful of those analytics.
Multi-Touch Attribution
A customer rarely converts after reading one piece of content. They might read a blog post. Watch a video. Open an email. Click a social ad. Then buy.
Multi-touch attribution assigns credit across all customer interaction points. The system shows you which content elements contributed to the final sale that customers made.
Last-click attribution gives 100% of the credit to the final touchpoint. The method of last-click attribution establishes a value of zero for content that exists at the top of the funnel, which includes educational blog posts and brand awareness videos. Multi-touch models show the full picture.
Assisted Conversions
GA4 tracks assisted conversions. These are conversions where a content piece played a role in the customer journey without being the final click.
A blog post that assists 500 conversions per month is highly valuable even if it never gets the final click credit. The complete impact of each content piece can be assessed through the measurement of both direct conversions and assisted conversions.
The Biggest Mistakes That Kill Your ROI Measurement
Avoid these traps, and your data will be far more reliable.
- Measuring too soon. Checking ROI after two weeks tells you almost nothing. Give content at least 90 days before drawing conclusions.
- Ignoring total costs. If you only count ad spend and forget writer fees, tool subscriptions, and design costs, your ROI will look artificially high.
- Measuring too soon. After two weeks, checking ROI will hardly tell you anything. Allow content a minimum of 90 days to draw conclusions.
- Applying the incorrect attribution model. Last-Click attribution underestimates awareness content. Take time to create a multi-touch model.
- Failing to measure offline conversions. B2B buyers tend to make buying decisions over the phone following content reading. Link your CRM data to your analytics platform to have such conversions attributed.
- Misleading correlation with causation. An increase in sales during a content campaign does not necessarily imply that the campaign is the cause of the increase. Isolate the real effect of your content by using control groups and A/B testing.
How to Use ROI Data to Build a Better Content Strategy
Measurement is not the end goal. Optimization is.
Once you have reliable ROI data, use it to:
- Shift budget toward high-performing content types. If long-form guides generate 400% ROI and short social posts generate 20%, the answer is obvious.
- Increase investment in high-ROI areas. When one category of content constantly performs well, the other ones generate more content in that space.
- Discontinue or repair poor-performing content. An unprofitable piece of content is either not reaching the correct audience or is not converting. Modify it or discontinue it.
- Develop foreseeable revenue models. Previous ROI history allows you to predict the probable payback of a new piece of content. This renders budget planning much more certain and justifiable.
Turn Your Content from a Cost Center Into a Revenue Engine
Most companies treat content as a cost. The best ones treat it as an asset because they measure it correctly.
We offer SEO services and content strategies built around exactly that. ResultFirst helps you identify which content drives real conversions, align creative output with business outcomes, and build a system that generates measurable returns month after month. Stop publishing in the dark and start making every content dollar accountable.
[Talk to ResultFirst Today.]
Source Referenced:
WHAT TO READ NEXT
READY TO BUILD PREDICTABLE ORGANIC GROWTH?
We are the only TOP SEO services agency providing Real Results in a Real Performance model. We help growth hungry companies outperform their competition and achieve 300%+ growth in their digital marketing initiatives.
- San Jose, CA, 95120

- +1-888-512-1890

- sales@resultfirst.com

300K+
KEYWORDS RANKED
546M+
REVENUE GENERATED
18 Years
SOLVING COMPLEX SEO
150+
TEAM MEMBERS